
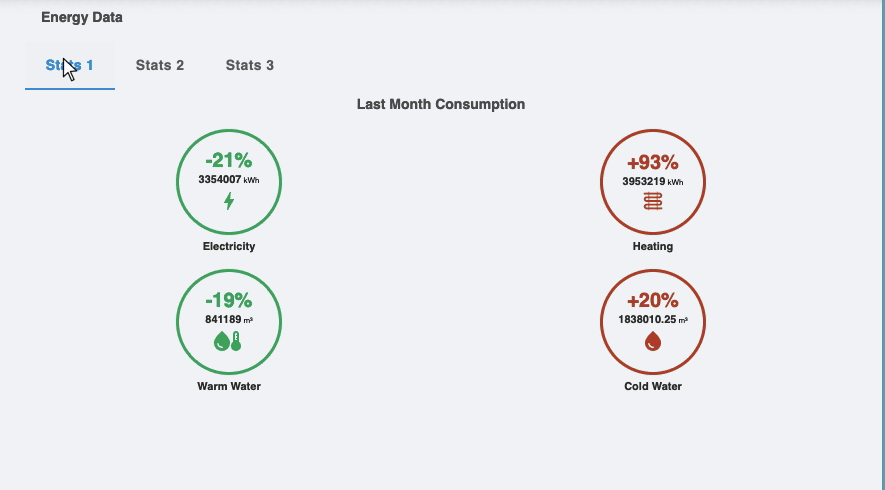
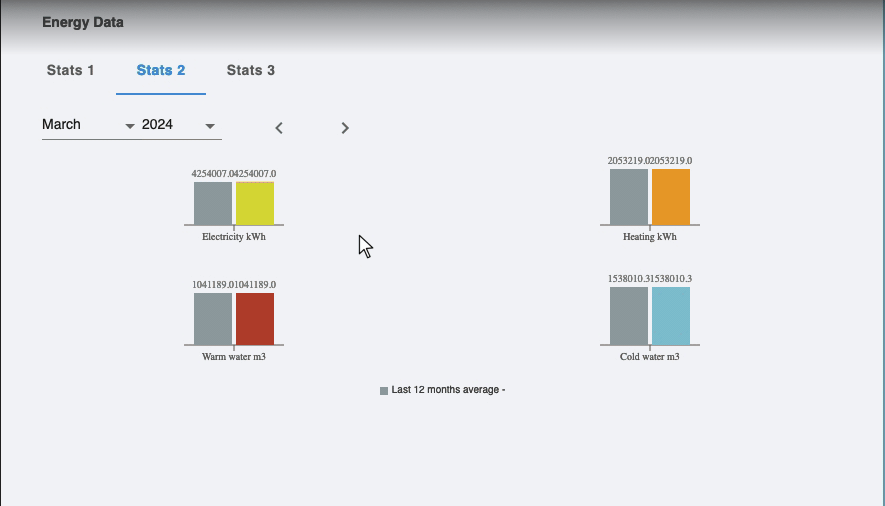
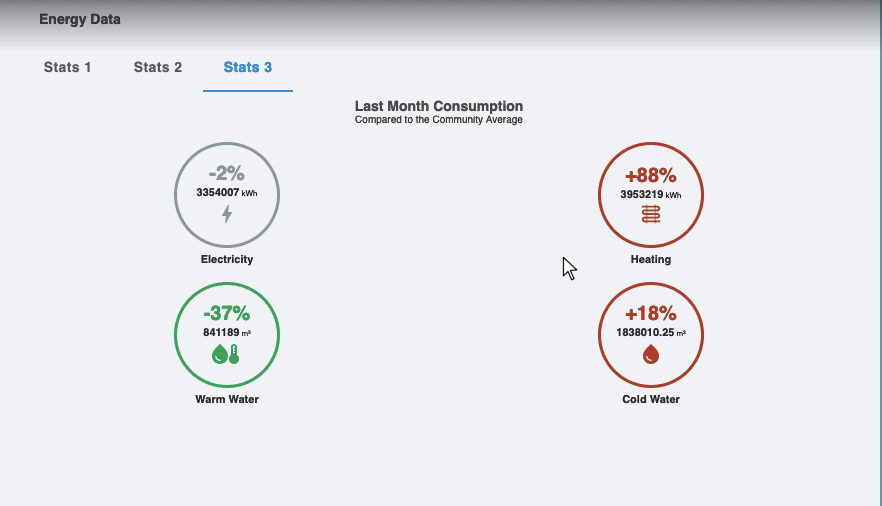
Residents track their monthly energy and water consumption directly in the Resident Portal — and see at a glance how they compare to their neighbours.
2 more images
2 more images
2 more images
Feature description
SPIE is a leading European multitechnical services company specialising in energy and building management. Through the integration with Allthings, residents gain direct visibility into their energy and water consumption — right inside the Resident Portal they already use every day.
What this integration does:
Shows each resident's last month's consumption across four individual meters: electricity (kWh), heating (kWh), hot water (m³), and cold water (m³)
Compares the current month's consumption to the unit's own 12-month average, so residents can track their personal progress over time
Displays a community benchmark — a colour indicator (red / blue / green) shows whether the unit's consumption is above, on par with, or below the average for similar unit types in the building
Automatically clears historical data when a tenancy ends, keeping records clean and privacy-compliant
Benefits:
Residents gain immediate awareness of their energy footprint without leaving the Resident Portal
Property management provides a value-added service that encourages responsible consumption across the building
Data is refreshed every month automatically — no manual reporting or file exports needed
Technical feature elements
Allthings data structure
This solution leverages the central Allthings data structure. As a result, all data relating to users, units, buildings, and projects is based directly on the standard Allthings data model.
Allthings role and permissions
This feature allows connected solutions to inherit roles and permissions directly from Allthings. This ensures that standard roles—such as property managers and caretakers—along with their permissions, are seamlessly utilized.
Native integration
Native integration provides a custom-tailored view for the external solution. This ensures seamless integration on both the backend and the frontend.
KPI visualization
The KPI visualization feature gives property management team members direct access to all relevant key performance indicators.
Additional information
User flow rating
Level 2 of 3
Available countries
- Switzerland
Technical feature elements
- Allthings data structure
- Allthings role and permissions
- Native integration
- KPI visualization
Developed for
- Residents
- Property management
Solution provider
Contact
Contact sales